What is A/B Testing? Complete Split Testing Guide
What is A/B Testing? The Complete Breakdown
A/B Testing is essentially the scientific method applied to marketing. Think of it as the marketing world's version of a taste test – except instead of asking "Coke or Pepsi?", you're asking "Red button or blue button?" and letting the data do the talking.
At its core, A/B Testing involves:
- Creating two variants of the same marketing element
- Splitting your audience randomly between the versions
- Measuring performance against predetermined goals
- Implementing the winner based on statistical significance
This methodology eliminates guesswork and personal preferences, replacing them with cold, hard data. In other words, A/B testing turns opinions into evidence.
The Science Behind A/B Testing
A/B Testing relies on statistical significance to ensure results aren't just random chance. Statistical tools such as the confidence and improvement intervals described in Optimizely's documentation show how much uncertainty surrounds any measured lift. The process works because it controls for external variables while isolating the impact of specific changes.
How A/B Testing Works: Step-by-Step Process
1. Hypothesis Formation
Start with a clear hypothesis: "If I change [specific element], then [expected outcome] will occur because [reasoning]."
Example: "If I change the CTA button color from green to orange, then click-through rates will increase because orange creates more visual contrast against our blue background."
2. Element Selection
Choose one variable to test at a time:
- Headlines
- Call-to-action buttons
- Images
- Email subject lines
- Landing page layouts
- Pricing displays
3. Audience Splitting
Randomly divide your audience into two equal groups:
- Control Group (A): Sees the original version
- Test Group (B): Sees the modified version
4. Data Collection
Run the test until you achieve statistical significance, typically requiring:
- Minimum sample size: calculated before launch from your baseline conversion rate, the smallest effect you want to detect, and your significance and power settings
- Test duration: At least one full business cycle (often 1-2 weeks)
- Confidence level: 95% statistical significance
5. Results Analysis
Compare performance metrics and implement the winning version.
Real-World A/B Testing Examples & Results
Example 1: Netflix's Artwork Testing
Netflix continuously A/B tests thumbnail images for shows and movies. Their engineering blog describes how they personalize artwork using contextual bandits and online testing. They test different images to see which thumbnails generate more clicks for different user segments.
Source: Netflix Technology Blog - Artwork Personalization
Example 2: Bing's Ad Headline Test
A Microsoft engineer proposed a small change to how Bing displayed ad headlines, lengthening them by combining the title with text from the line below. The idea sat in the backlog for months; once tested, it increased revenue by 12%, which on an annual basis would come to more than $100 million in the United States alone.
Source: Harvard Business Review, Ron Kohavi and Stefan Thomke, "The Surprising Power of Online Experiments" (2017)
Example 3: The 2008 Obama Campaign's Splash Page
Barack Obama's 2008 presidential campaign tested combinations of buttons and media on its sign-up page. The winning combination, a "Learn More" button with a family photo, raised the sign-up rate from 8.26% to 11.6%, an improvement of 40.6% by Optimizely's count, which it estimated meant about 2.88 million extra email addresses and $60 million in additional donations.
Example 4: HubSpot's Mobile CTA Test
HubSpot tested new calls-to-action on the mobile versions of its blog offer pages:
- Control: the existing mobile call-to-action
- Variants B, C, and D: three redesigned mobile CTAs
All three variants beat the control on conversion rate. Variant C performed best with a 10% increase, which HubSpot projected would bring about 1,400 more content leads per month.
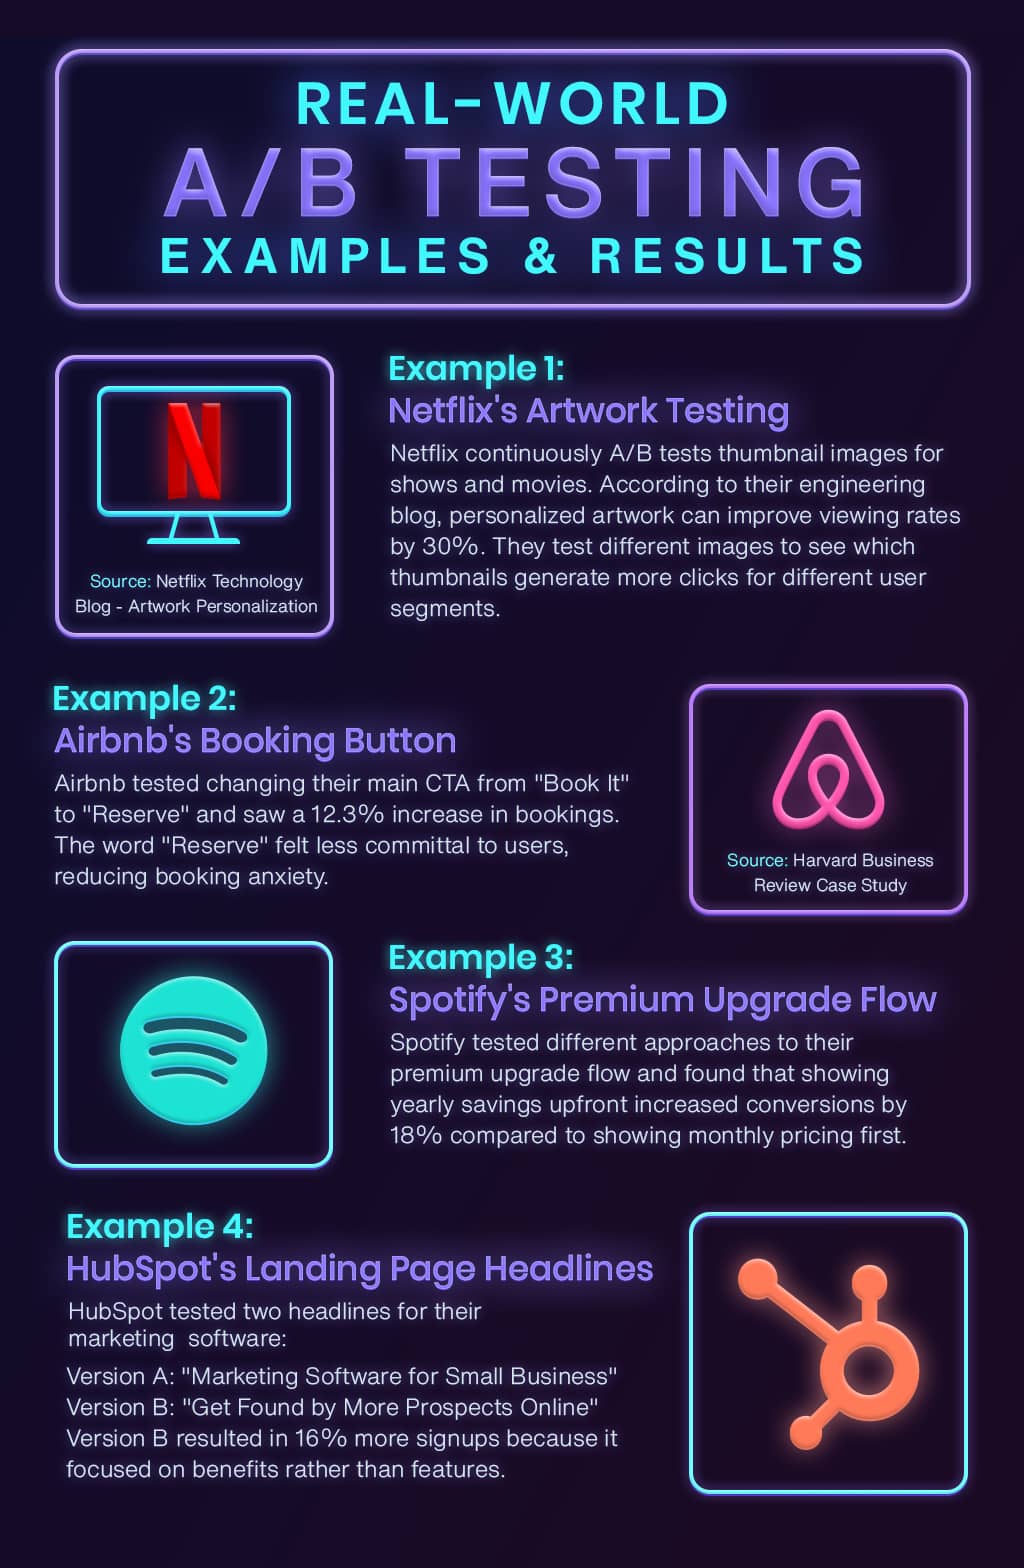
Real-World A/B Testing Results: Company Case Studies & Benchmarks
| Company | Test Element | Change Made | Result | Impact Level | Key Insight |
|---|---|---|---|---|---|
| Bing | Ad Headline Display | Longer ad headlines | +12% revenue | High | Small change, $100M+ yearly value |
| Obama 2008 Campaign | Sign-up Page | Button + image combination | +40.6% | High | About 2.88M extra sign-ups |
| HubSpot | Mobile CTAs | Redesigned mobile CTA | +10% | High | Mobile-specific CTAs pay off |
| Multi-variant Tests | Optimizely dataset | More variations vs. simple A/B | Up to 1.7x impact | High | More variations, more impact |
Types of A/B Testing
1. Simple A/B Testing
Testing two versions of a single element.
2. Multivariate Testing (MVT)
Testing multiple elements simultaneously to understand interactions between variables.
3. Split URL Testing
Comparing completely different page designs or flows.
4. Multi-page Testing
Testing changes across multiple pages in a user journey.
A/B Testing Tools & Platforms
Free Tools:
- Google Optimize (sunset in September 2023)
- Facebook's built-in ad testing
- Mailchimp's A/B testing feature
Paid Platforms:
- Optimizely: Enterprise-level testing platform
- VWO (Visual Website Optimizer): User-friendly interface
- Adobe Target: Integrated with Adobe Marketing Cloud
- Unbounce: Specialized for landing page testing
Industry Data: CXL's State of Conversion Optimization 2020 report found that running 1-2 tests per month was the most common testing pace, reported by 46.9% of respondents.
Related Marketing Terms
Understanding A/B Testing connects to several key marketing concepts:
- Conversion Rate Optimization (CRO) - A/B testing is the primary method for CRO
- Statistical Significance - Critical for validating A/B test results
- Landing Page Optimization - Common application of A/B testing
- Email Marketing - A/B testing subject lines and content
- Call-to-Action (CTA) - Frequently tested element
- Customer Journey - A/B testing optimizes each touchpoint
- Bounce Rate - Metric often improved through A/B testing
- Click-Through Rate (CTR) - Primary measurement in many A/B tests
Frequently Asked Questions (FAQs)
What is A/B Testing in simple terms?
A/B Testing resembles a scientific experiment in marketing, wherein two distinct versions of a product (such as a webpage or email) are shown to separate groups to determine which variant performs more effectively.
How long should an A/B test run?
Most A/B tests should run for 1-4 weeks to account for daily and weekly variations in user behavior. The key is reaching the sample size you calculated before launch, rather than stopping as soon as a result looks significant.
Check in A/B test sample size calculator
What's the difference between A/B Testing and Multivariate Testing?
A/B Testing compares two versions of one element, while Multivariate Testing examines multiple elements simultaneously. A/B testing is simpler and requires smaller sample sizes.
Can I test multiple things at once?
It's better to test one element at a time in A/B tests to clearly identify what caused performance changes. For testing multiple elements, use Multivariate Testing instead.
What sample size do I need for A/B Testing?
There is no universal minimum. The sample you need depends on your baseline conversion rate, the smallest effect you want to detect, and your significance and power settings. Use a sample size calculator to determine exact requirements before the test starts.
What if my A/B test shows no winner?
If results aren't statistically significant at the sample size you planned, treat the test as inconclusive: try a more dramatic change, or accept that the current version is performing adequately. Only extend a test if your chosen method (for example, a sequential testing approach) allows it.
How much improvement should I expect from A/B Testing?
There is no reliable universal average. Results depend on the page, the traffic, and the size of the change being tested, so set expectations per test rather than from industry averages.
A/B Testing Best Practices
1. Start with High-Impact Elements
Focus on elements that directly influence conversions:
- Headlines and value propositions
- Call-to-action buttons (text, color, placement)
- Forms (length, fields, layout)
- Images and videos
- Pricing displays
2. Test One Variable at a Time
Avoid the temptation to test multiple changes simultaneously. Growth expert Sean Ellis, co-author of Hacking Growth, built his approach around disciplined experimentation, and the simplest version of that discipline is to change one thing, measure the impact, learn, and iterate.
3. Ensure Statistical Significance
Don't stop tests early due to exciting preliminary results. False positives can cost you real revenue. Wait for 95% confidence levels before declaring winners.
4. Consider External Factors
Account for:
- Seasonal variations (holidays, end-of-month, weekly cycles)
- Traffic source differences (social media vs. email vs. organic)
- Device and browser variations
5. Document Everything
Keep detailed records of:
- Test hypotheses and reasoning
- Exact changes made
- Results and statistical significance
- Implementation dates
- Lessons learned
6. Test Continuously
A/B testing isn't a one-time activity. CXL's survey shows how much testing pace varies: 1-2 tests per month was most common (46.9% of respondents), while 9.5% of optimizers ran 20 or more tests per month. Teams that test steadily build up learnings much faster.
Source : CXL - State of Conversion Optimization Report 2020
A/B Testing Elements: Priority Matrix for Conversion Optimization (Illustrative Ranges)
| Element Category | Impact Level | Test Difficulty | Illustrative Lift | Implementation Time | Business Risk |
|---|---|---|---|---|---|
| Headlines & Value Props | High | Low | 15-30% | 1-2 days | Low |
| CTA Buttons (Text) | High | Low | 10-25% | 1 day | Low |
| CTA Buttons (Color) | Medium | Low | 5-15% | 1 day | Low |
| Form Length | High | Medium | 20-40% | 3-5 days | Medium |
| Pricing Display | High | High | 15-35% | 5-10 days | High |
| Page Layout | High | High | 25-50% | 1-2 weeks | High |
| Images/Videos | Medium | Medium | 8-20% | 2-3 days | Low |
| Navigation Menu | Medium | High | 10-25% | 1 week | Medium |
| Product Descriptions | Medium | Medium | 12-22% | 3-5 days | Low |
| Social Proof Elements | Medium | Low | 8-18% | 1-2 days | Low |
Common A/B Testing Mistakes to Avoid
1. Stopping Tests Too Early
The Problem: Getting excited by early results and implementing changes before reaching statistical significance.
The Solution: Set a minimum test duration and sample size before starting.
2. Testing Too Many Variables
The Problem: Changing multiple elements makes it impossible to identify what drove results.
The Solution: Focus on one primary variable per test.
3. Ignoring Mobile vs. Desktop
The Problem: Results may vary significantly between device types.
The Solution: Segment results by device and optimize accordingly.
4. Testing Insignificant Elements
The Problem: Testing minor details that won't meaningfully impact business goals.
The Solution: Prioritize high-impact elements that directly influence conversions.
Further reading: CXL
Advanced A/B Testing Strategies
1. Sequential Testing
Run related tests in sequence to compound improvements. For example:
- Test headline variations
- Test CTA button colors
- Test form lengths
- Test page layouts
2. Segment-Specific Testing
Different audience segments may respond differently. Test variations for:
- New vs. returning visitors
- Traffic sources (organic, paid, social)
- Geographic locations
- Device types
3. Personalization Testing
Use dynamic content to test personalized experiences based on:
- Past behavior
- Demographics
- Purchase history
- Browsing patterns
The Future of A/B Testing
AI-Powered Testing
Machine learning is revolutionizing A/B testing through:
- Automated test creation based on user behavior patterns
- Real-time optimization adjusting traffic allocation to winning variations
- Predictive analytics estimating test outcomes faster
Privacy-First Testing
With increased privacy regulations, the industry is moving toward:
- First-party data reliance
- Server-side testing for better privacy compliance
- Cookieless testing methodologies
Industry Outlook: AI-assisted features are quickly becoming standard in experimentation platforms. To see how users rate one such platform, check Gartner's Peer Insights reviews of Optimizely Web Experimentation.
Conclusion: Why A/B Testing Matters
A/B Testing isn't just a marketing tactic – it's a mindset shift toward data-driven decision making. In an era where customer acquisition costs are rising and attention spans are shrinking, the ability to optimize based on real user behavior rather than assumptions is invaluable.
Companies like Amazon, Google, and Netflix built their empires partly through relentless A/B testing. As Amazon founder Jeff Bezos once said: "Our success at Amazon is a function of how many experiments we do per year, per month, per week, per day."
The beauty of A/B testing lies in its democratic nature – you don't need a massive budget or complex tools to start. You just need curiosity, patience, and a commitment to letting data guide your decisions.
Start small, test consistently, and remember: in the world of marketing, the best opinion is the one backed by data. Your customers are already telling you what they want – A/B testing just helps you listen.
Sources:
- Optimizely. "Confidence intervals and improvement intervals" (documentation)
- CXL. (2020). "State of Conversion Optimization Report"
- Netflix Technology Blog. (2017). "Artwork Personalization at Netflix"
- Harvard Business Review. (2017). "The Surprising Power of Online Experiments" (Kohavi and Thomke)
- Optimizely. (2026). "173k experiments later, here's what we learned"
- HubSpot Blog. "A/B testing examples" (HubSpot experiments)
